Volume Weighted RSI (VW RSI)The Volume Weighted RSI (VW RSI) is a momentum oscillator designed for TradingView, implemented in Pine Script v6, that enhances the traditional Relative Strength Index (RSI) by incorporating trading volume into its calculation. Unlike the standard RSI, which measures the speed and change of price movements based solely on price data, the VW RSI weights its analysis by volume, emphasizing price movements backed by significant trading activity. This makes the VW RSI particularly effective for identifying bullish or bearish momentum, overbought/oversold conditions, and potential trend reversals in markets where volume plays a critical role, such as stocks, forex, and cryptocurrencies.
Key Features
Volume-Weighted Momentum Calculation:
The VW RSI calculates momentum by comparing the volume associated with upward price movements (up-volume) to the volume associated with downward price movements (down-volume).
Up-volume is the volume on bars where the closing price is higher than the previous close, while down-volume is the volume on bars where the closing price is lower than the previous close.
These volumes are smoothed over a user-defined period (default: 14 bars) using a Running Moving Average (RMA), and the VW RSI is computed using the formula:
\text{VW RSI} = 100 - \frac{100}{1 + \text{VoRS}}
where
\text{VoRS} = \frac{\text{Average Up-Volume}}{\text{Average Down-Volume}}
.
Oscillator Range and Interpretation:
The VW RSI oscillates between 0 and 100, with a centerline at 50.
Above 50: Indicates bullish volume momentum, suggesting that volume on up bars dominates, which may signal buying pressure and a potential uptrend.
Below 50: Indicates bearish volume momentum, suggesting that volume on down bars dominates, which may signal selling pressure and a potential downtrend.
Overbought/Oversold Levels: User-defined thresholds (default: 70 for overbought, 30 for oversold) help identify potential reversal points:
VW RSI > 70: Overbought, indicating a possible pullback or reversal.
VW RSI < 30: Oversold, indicating a possible bounce or reversal.
Visual Elements:
VW RSI Line: Plotted in a separate pane below the price chart, colored dynamically based on its value:
Green when above 50 (bullish momentum).
Red when below 50 (bearish momentum).
Gray when at 50 (neutral).
Centerline: A dashed line at 50, optionally displayed, serving as the neutral threshold between bullish and bearish momentum.
Overbought/Oversold Lines: Dashed lines at the user-defined overbought (default: 70) and oversold (default: 30) levels, optionally displayed, to highlight extreme conditions.
Background Coloring: The background of the VW RSI pane is shaded red when the indicator is in overbought territory and green when in oversold territory, providing a quick visual cue of potential reversal zones.
Alerts:
Built-in alerts for key events:
Bullish Momentum: Triggered when the VW RSI crosses above 50, indicating a shift to bullish volume momentum.
Bearish Momentum: Triggered when the VW RSI crosses below 50, indicating a shift to bearish volume momentum.
Overbought Condition: Triggered when the VW RSI crosses above the overbought threshold (default: 70), signaling a potential pullback.
Oversold Condition: Triggered when the VW RSI crosses below the oversold threshold (default: 30), signaling a potential bounce.
Input Parameters
VW RSI Length (default: 14): The period over which the up-volume and down-volume are smoothed to calculate the VW RSI. A longer period results in smoother signals, while a shorter period increases sensitivity.
Overbought Level (default: 70): The threshold above which the VW RSI is considered overbought, indicating a potential reversal or pullback.
Oversold Level (default: 30): The threshold below which the VW RSI is considered oversold, indicating a potential reversal or bounce.
Show Centerline (default: true): Toggles the display of the 50 centerline, which separates bullish and bearish momentum zones.
Show Overbought/Oversold Lines (default: true): Toggles the display of the overbought and oversold threshold lines.
How It Works
Volume Classification:
For each bar, the indicator determines whether the price movement is upward or downward:
If the current close is higher than the previous close, the bar’s volume is classified as up-volume.
If the current close is lower than the previous close, the bar’s volume is classified as down-volume.
If the close is unchanged, both up-volume and down-volume are set to 0 for that bar.
Smoothing:
The up-volume and down-volume are smoothed using a Running Moving Average (RMA) over the specified period (default: 14 bars) to reduce noise and provide a more stable measure of volume momentum.
VW RSI Calculation:
The Volume Relative Strength (VoRS) is calculated as the ratio of smoothed up-volume to smoothed down-volume.
The VW RSI is then computed using the standard RSI formula, but with volume data instead of price changes, resulting in a value between 0 and 100.
Visualization and Alerts:
The VW RSI is plotted with dynamic coloring to reflect its momentum direction, and optional lines are drawn for the centerline and overbought/oversold levels.
Background coloring highlights overbought and oversold conditions, and alerts notify the trader of significant crossings.
Usage
Timeframe: The VW RSI can be used on any timeframe, but it is particularly effective on intraday charts (e.g., 1-hour, 4-hour) or daily charts where volume data is reliable. Shorter timeframes may require a shorter length for increased sensitivity, while longer timeframes may benefit from a longer length for smoother signals.
Markets: Best suited for markets with significant and reliable volume data, such as stocks, forex, and cryptocurrencies. It may be less effective in markets with low or inconsistent volume, such as certain futures contracts.
Trading Strategies:
Trend Confirmation:
Use the VW RSI to confirm the direction of a trend. For example, in an uptrend, look for the VW RSI to remain above 50, indicating sustained bullish volume momentum, and consider buying on pullbacks when the VW RSI dips but stays above 50.
In a downtrend, look for the VW RSI to remain below 50, indicating sustained bearish volume momentum, and consider selling on rallies when the VW RSI rises but stays below 50.
Overbought/Oversold Conditions:
When the VW RSI crosses above 70, the market may be overbought, suggesting a potential pullback or reversal. Consider taking profits on long positions or preparing for a short entry, but confirm with price action or other indicators.
When the VW RSI crosses below 30, the market may be oversold, suggesting a potential bounce or reversal. Consider entering long positions or covering shorts, but confirm with additional signals.
Divergences:
Look for divergences between the VW RSI and price to spot potential reversals. For example, if the price makes a higher high but the VW RSI makes a lower high, this bearish divergence may signal an impending downtrend.
Conversely, if the price makes a lower low but the VW RSI makes a higher low, this bullish divergence may signal an impending uptrend.
Momentum Shifts:
A crossover above 50 can signal the start of bullish momentum, making it a potential entry point for long trades.
A crossunder below 50 can signal the start of bearish momentum, making it a potential entry point for short trades or an exit for long positions.
Example
On a 4-hour SOLUSDT chart:
During an uptrend, the VW RSI might rise above 50 and stay there, confirming bullish volume momentum. If it approaches 70, it may indicate overbought conditions, as seen near a price peak of 145.08, suggesting a potential pullback.
During a downtrend, the VW RSI might fall below 50, confirming bearish volume momentum. If it drops below 30 near a price low of 141.82, it may indicate oversold conditions, suggesting a potential bounce, as seen in a slight recovery afterward.
A bullish divergence might occur if the price makes a lower low during the downtrend, but the VW RSI makes a higher low, signaling a potential reversal.
Limitations
Lagging Nature: Like the traditional RSI, the VW RSI is a lagging indicator because it relies on smoothed data (RMA). It may not react quickly to sudden price reversals, potentially missing the start of new trends.
False Signals in Ranging Markets: In choppy or ranging markets, the VW RSI may oscillate around 50, generating frequent crossovers that lead to false signals. Combining it with a trend filter (e.g., ADX) can help mitigate this.
Volume Data Dependency: The VW RSI relies on accurate volume data, which may be inconsistent or unavailable in some markets (e.g., certain forex pairs or futures contracts). In such cases, the indicator’s effectiveness may be reduced.
Overbought/Oversold in Strong Trends: During strong trends, the VW RSI can remain in overbought or oversold territory for extended periods, leading to premature exit signals. Use additional confirmation to avoid exiting too early.
Potential Improvements
Smoothing Options: Add options to use different smoothing methods (e.g., EMA, SMA) instead of RMA for the up/down volume calculations, allowing users to adjust the indicator’s responsiveness.
Divergence Detection: Include logic to detect and plot bullish/bearish divergences between the VW RSI and price, providing visual cues for potential reversals.
Customizable Colors: Allow users to customize the colors of the VW RSI line, centerline, overbought/oversold lines, and background shading.
Trend Filter: Integrate a trend strength filter (e.g., ADX > 25) to ensure signals are generated only during strong trends, reducing false signals in ranging markets.
The Volume Weighted RSI (VW RSI) is a powerful tool for traders seeking to incorporate volume into their momentum analysis, offering a unique perspective on market dynamics by emphasizing price movements backed by significant trading activity. It is best used in conjunction with other indicators and price action analysis to confirm signals and improve trading decisions.
Cari skrip untuk "Relative Strength Index (RSI)"

RSI with Bollinger Bands and Buy/Sell SignalsPurpose:
This indicator combines the Relative Strength Index (RSI) with Bollinger Bands to identify overbought and oversold conditions in the market. It also generates buy and sell signals based on the interaction between the RSI and the Bollinger Bands. It is particularly useful for traders looking for opportunities in volatile or trending markets.
How It Works:
RSI (Relative Strength Index):
The RSI measures the magnitude of recent price changes to evaluate whether an asset is overbought (values > 70) or oversold (values < 30).
In this indicator, horizontal lines at levels 70 (overbought) and 30 (oversold) are used as reference points.
Bollinger Bands:
Bollinger Bands are calculated around a smoothed moving average of the RSI. The upper band represents dynamic overbought levels, while the lower band indicates dynamic oversold levels.
These bands automatically adjust their width based on the volatility of the RSI, allowing them to adapt to different market conditions.
Buy and Sell Signals:
Buy Signal: A buy signal is generated when the RSI exceeds both the upper Bollinger Band and the overbought level (70). This suggests that the asset is in an extreme bullish phase.
Sell Signal: A sell signal is generated when the RSI falls below both the lower Bollinger Band and the oversold level (30). This suggests that the asset is in an extreme bearish phase.
Alerts:
The indicator includes automatic alerts to notify you when buy or sell signals are generated. This allows traders to act quickly on new opportunities.
Best Practices:
Confirmation in Lower Timeframes:
Although this indicator is powerful, it is recommended to confirm signals in lower timeframes before making trading decisions. For example:
If you receive a buy signal on a 4-hour chart, check if the RSI and Bollinger Bands on lower timeframes (such as 1 hour or 15 minutes) also show bullish signals.
This reduces the risk of false positives and increases the accuracy of your entries.
Use in Trends:
This indicator works best in markets with clear trends. In sideways or low-volatility markets, signals may be less reliable due to the lack of directional momentum.
Risk Management:
Always use stop-loss and take-profit to protect your positions. Buy and sell signals are just one tool for analysis; they do not guarantee results.
Combination with Other Indicators:
To improve accuracy, consider combining this indicator with others, such as MACD, Stochastic Oscillator, or Japanese candlestick patterns. This can provide additional confirmation before opening a position.
Summary:
The RSI + Bollinger Bands with Buy/Sell Signals indicator is an advanced tool designed to identify entry and exit points in the market based on extreme overbought and oversold conditions. However, to maximize its effectiveness, it is crucial to confirm signals in lower timeframes and use it in combination with other technical analysis tools. With proper risk management and careful interpretation of signals, this indicator can be a valuable ally in your trading strategy.

Ichimoku + RSI + MACD Strategy1. Relative Strength Index (RSI)
Overview:
The Relative Strength Index (RSI) is a momentum oscillator that measures the speed and change of price movements. It ranges from 0 to 100 and is typically used to identify overbought or oversold conditions in a market.
How to Use with Ichimoku:
Long Entry: Look for RSI to be above 30 (indicating it is not oversold) when the price is above the Ichimoku Cloud.
Short Entry: Look for RSI to be below 70 (indicating it is not overbought) when the price is below the Ichimoku Cloud.
2. Moving Average Convergence Divergence (MACD)
Overview:
The MACD is a trend-following momentum indicator that shows the relationship between two moving averages of a security’s price. It consists of the MACD line, signal line, and histogram.
How to Use with Ichimoku:
Long Entry: Enter a long position when the MACD line crosses above the signal line while the price is above the Ichimoku Cloud.
Short Entry: Enter a short position when the MACD line crosses below the signal line while the price is below the Ichimoku Cloud.
Combined Strategy Example
Here’s a brief outline of how to structure a trading strategy using Ichimoku, RSI, and MACD:
Long Entry Conditions:
Price is above the Ichimoku Cloud.
RSI is above 30.
MACD line crosses above the signal line.
Short Entry Conditions:
Price is below the Ichimoku Cloud.
RSI is below 70.
MACD line crosses below the signal line.
Exit Conditions:
Exit long when MACD line crosses below the signal line.
Exit short when MACD line crosses above the signal line.

Advanced Multi-Timeframe Trend DetectorThis script is designed to provide a multi-timeframe trend analysis, combining moving averages (MAs) and the Relative Strength Index (RSI) to determine market direction across different timeframes. Here's a breakdown of what the script does:
Key Components of the Script
Inputs:
Moving Averages: Short and long moving average lengths (9 and 21 periods).
ATR and RSI Lengths: ATR (Average True Range) and RSI (Relative Strength Index) lengths set to 14 periods.
RSI Levels: Overbought and oversold levels for the RSI set to 70 and 30, respectively.
Trend Determination:
A function called trendDirection evaluates the trend based on the closing prices of the current and previous periods, as well as the RSI value.
It classifies the trend as "Up", "Down", or "Sideways" based on the conditions:
Up: Current close is higher than the previous close and RSI is below the overbought level.
Down: Current close is lower than the previous close and RSI is above the oversold level.
Sideways: If neither condition is met.
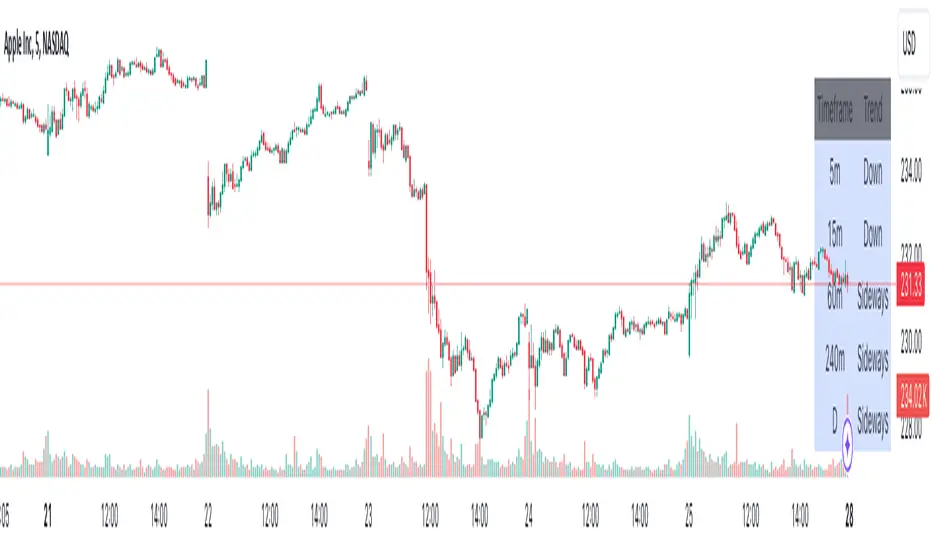
Table Creation:
A table is created at the bottom right of the chart to display the trend for different timeframes (5m, 15m, 60m, 240m, and Daily).
The table is initialized with headers and then populated with the trend results for each timeframe.
Calculating Trends for Each Timeframe:
The script fetches the current and previous close prices for each timeframe using request.security().
It calculates the RSI for each timeframe and then calls the trendDirection function to determine the trend.
Displaying Trends:
The results are displayed in a table format, with each timeframe and its corresponding trend.
Summary
Overall, this script provides a concise way to visualize market trends across multiple timeframes, using MAs and RSI to offer a more nuanced view of potential market movements. This can help traders make more informed decisions based on the prevailing trends.
RSI 15/60 and ADX PlotIn this script, the buy and sell criteria are based on the Relative Strength Index (RSI) values calculated for two different timeframes: the 15-minute RSI and the hourly RSI. These timeframes are used together to check signals when certain thresholds are crossed, providing confirmation across both short-term and longer-term momentum.
Buy Criteria:
Condition 1:
Hourly RSI > 60: This means the longer-term momentum shows strength.
15-minute RSI crosses above 60: This shows that the shorter-term momentum is catching up and confirms increasing strength.
Condition 2:
15-minute RSI > 60: This indicates that the short-term trend is already strong.
Hourly RSI crosses above 60: This confirms that the longer-term trend is also gaining strength.
Both conditions aim to capture the moments when the market shows increasing strength across both short and long timeframes, signaling a potential buy opportunity.
Sell Criteria:
Condition 1:
Hourly RSI < 40: This indicates that the longer-term trend is weakening.
15-minute RSI crosses below 40: The short-term momentum is also turning down, confirming the weakening trend.
Condition 2:
15-minute RSI < 40: The short-term trend is already weak.
Hourly RSI crosses below 40: The longer-term trend is now confirming the weakness, indicating a potential sell.
These conditions work to identify when the market is showing weakness in both short-term and long-term timeframes, signaling a potential sell opportunity.
ADX Confirmation :
The Average Directional Index (ADX) is a key tool for measuring the strength of a trend. It can be used alongside the RSI to confirm whether a buy or sell signal is occurring in a strong trend or during market consolidation. Here's how ADX can be integrated:
ADX > 25: This indicates a strong trend. Using this threshold, you can confirm buy or sell signals when there is a strong upward or downward movement in the market.
Buy Example: If a buy signal (RSI > 60) is triggered and the ADX is above 25, this confirms that the market is in a strong uptrend, making the buy signal more reliable.
Sell Example: If a sell signal (RSI < 40) is triggered and the ADX is above 25, it confirms a strong downtrend, validating the sell signal.
ADX < 25: This suggests a weak or non-existent trend. In this case, RSI signals might be less reliable since the market could be moving sideways.
Final Approach:
The RSI criteria help identify potential overbought and oversold conditions in both short and long timeframes.
The ADX confirmation ensures that the signals generated are happening during strong trends, increasing the likelihood of successful trades by filtering out weak or choppy market conditions.
This combination of RSI and ADX can help traders make more informed decisions by ensuring both momentum and trend strength align before entering or exiting trades.

RSI K-Means Clustering [UAlgo]The "RSI K-Means Clustering " indicator is a technical analysis tool that combines the Relative Strength Index (RSI) with K-means clustering techniques. This approach aims to provide more nuanced insights into market conditions by categorizing RSI values into overbought, neutral, and oversold clusters.
The indicator adjusts these clusters dynamically based on historical RSI data, allowing for more adaptive and responsive thresholds compared to traditional fixed levels. By leveraging K-means clustering, the indicator identifies patterns in RSI behavior, which can help traders make more informed decisions regarding market trends and potential reversals.
🔶 Key Features
K-means Clustering: The indicator employs K-means clustering, an unsupervised machine learning technique, to dynamically determine overbought, neutral, and oversold levels based on historical RSI data.
User-Defined Inputs: You can customize various aspects of the indicator's behavior, including:
RSI Source: Select the data source used for RSI calculation (e.g., closing price).
RSI Length: Define the period length for RSI calculation.
Training Data Size: Specify the number of historical RSI values used for K-means clustering.
Number of K-means Iterations: Set the number of iterations performed by the K-means algorithm to refine cluster centers.
Overbought/Neutral/Oversold Levels: You can define initial values for these levels, which will be further optimized through K-means clustering.
Alerts: The indicator can generate alerts for various events, including:
Trend Crossovers: Alerts for when the RSI crosses above/below the neutral zone, signaling potential trend changes.
Overbought/Oversold: Alerts when the RSI reaches the dynamically determined overbought or oversold thresholds.
Reversals: Alerts for potential trend reversals based on RSI crossing above/below the calculated overbought/oversold levels.
RSI Classification: Alerts based on the current RSI classification (ranging, uptrend, downtrend).
🔶 Interpreting Indicator
Adjusted RSI Value: The primary plot represents the adjusted RSI value, calculated based on the relative position of the current RSI compared to dynamically adjusted overbought and oversold levels. This value provides an intuitive measure of the market's momentum. The final overbought, neutral, and oversold levels are determined by K-means clustering and are displayed as horizontal lines. These levels serve as dynamic support and resistance points, indicating potential reversal zones.
Classification Symbols : The "RSI K-Means Clustering " indicator uses specific symbols to classify the current market condition based on the position of the RSI value relative to dynamically determined clusters. These symbols provide a quick visual reference to help traders understand the prevailing market sentiment. Here's a detailed explanation of each classification symbol:
Ranging Classification ("R")
This symbol appears when the RSI value is closest to the neutral threshold compared to the overbought or oversold thresholds. It indicates a ranging market, where the price is moving sideways without a clear trend direction. In this state, neither buyers nor sellers are in control, suggesting a period of consolidation or indecision. This is often seen as a time to wait for a breakout or reversal signal before taking a position.
Up-Trend Classification ("↑")
The up-trend symbol, represented by an upward arrow, is displayed when the RSI value is closer to the overbought threshold than to the neutral or oversold thresholds. This classification suggests that the market is in a bullish phase, with buying pressure outweighing selling pressure. Traders may consider this as a signal to enter or hold long positions, as the price is likely to continue rising until the market reaches an overbought condition.
Down-Trend Classification ("↓")
The down-trend symbol, depicted by a downward arrow, appears when the RSI value is nearest to the oversold threshold. This indicates a bearish market condition, where selling pressure dominates. The market is likely experiencing a downward movement, and traders might view this as an opportunity to enter or hold short positions. This symbol serves as a warning of potential further declines, especially if the RSI continues to move toward the oversold level.
Bullish Reversal ("▲")
This signal occurs when the RSI value crosses above the oversold threshold. It indicates a potential shift from a downtrend to an uptrend, suggesting that the market may start to move higher. Traders might use this signal as an opportunity to enter long positions.
Bearish Reversal ("▼")
This signal appears when the RSI value crosses below the overbought threshold. It suggests a possible transition from an uptrend to a downtrend, indicating that the market may begin to decline. This signal can alert traders to consider entering short positions or taking profits on long positions.
These classification symbols are plotted near the adjusted RSI line, with their positions adjusted based on the standard deviation and a distance multiplier. This placement helps in visualizing the classification's strength and ensuring clarity in the indicator's presentation. By monitoring these symbols, traders can quickly assess the market's state and make more informed trading decisions.
🔶 Disclaimer
Use with Caution: This indicator is provided for educational and informational purposes only and should not be considered as financial advice. Users should exercise caution and perform their own analysis before making trading decisions based on the indicator's signals.
Not Financial Advice: The information provided by this indicator does not constitute financial advice, and the creator (UAlgo) shall not be held responsible for any trading losses incurred as a result of using this indicator.
Backtesting Recommended: Traders are encouraged to backtest the indicator thoroughly on historical data before using it in live trading to assess its performance and suitability for their trading strategies.
Risk Management: Trading involves inherent risks, and users should implement proper risk management strategies, including but not limited to stop-loss orders and position sizing, to mitigate potential losses.
No Guarantees: The accuracy and reliability of the indicator's signals cannot be guaranteed, as they are based on historical price data and past performance may not be indicative of future results.

RSI Trail [UAlgo]The RSI Trail indicator is a technical analysis tool designed to assist traders in making informed decisions by utilizing the Relative Strength Index (RSI) and various moving average calculations. This indicator dynamically plots support and resistance levels based on RSI values, providing visual cues for potential bullish and bearish signals. The inclusion of a trailing stop mechanism allows traders to adapt to market volatility, ensuring optimal entry and exit points.
🔶 Key Features
Multiple Moving Average Types: Choose from Simple Moving Average (SMA), Exponential Moving Average (EMA), Weighted Moving Average (WMA), Running Moving Average (RMA), and McGinley Dynamic for diverse analytical approaches.
Configurable RSI Bounds: Tailor the RSI lower and upper bounds to your specific trading preferences, with default settings at 40 and 60.
Signals: The indicator determines bullish and bearish market states and plots corresponding signals on the chart.
Customizable Visualization: Options to display the midline and color candles based on market state enhance visual analysis.
Alerts: Integrated alert conditions notify you of bullish and bearish signals.
🔶 Calculations
The RSI Trail indicator calculates dynamic support and resistance levels using a combination of moving averages and the Relative Strength Index (RSI). It starts by computing a chosen moving average (SMA, EMA, WMA, RMA, or McGinley) over a period of 27 using the typical price (ohlc4).
The indicator then defines upper and lower bounds based on customizable RSI levels (default 40 and 60) and adjusts these bounds using the Average True Range (ATR) to account for market volatility. The upper bound is calculated by adding a volatility-adjusted value to the moving average, while the lower bound is found by subtracting this value. Bullish signals occur when the price crosses above the upper bound, and bearish signals when it falls below the lower bound.
The RSI Trail indicator also can be used to identify pullback opportunities. When the price high/low crosses above/below the calculated upper/lower bound, it indicates a potential pullback, suggesting a favorable point to enter a trade during a pullback.
🔶 Disclaimer
This indicator is for informational purposes only and should not be considered financial advice.
Always conduct your own research and due diligence before making any trading decisions. Past performance is not necessarily indicative of future results.

Reversal Zones with SignalsThe "Reversal Zones with Signals" indicator is an advanced technical analysis tool designed to help traders identify potential market reversal points. By integrating Relative Strength Index (RSI), moving averages, and swing high/low detection, this indicator provides traders with clear visual cues for potential buy and sell opportunities.
Key Features and Benefits
Integration of Multiple Technical Analysis Tools:
The indicator seamlessly combines RSI, moving averages, and swing high/low detection. This multi-faceted approach enhances the reliability of the signals by confirming potential reversals through different technical analysis perspectives.
Customizable Parameters:
Users can adjust the sensitivity of the moving averages, the RSI overbought and oversold levels, and the length of the reversal zones. This flexibility allows traders to tailor the indicator to fit their specific trading strategies and market conditions.
Clear Visual Signals:
Buy and sell signals are plotted directly on the chart as easily recognizable green and red labels. This visual clarity simplifies the process of identifying potential entry and exit points, enabling traders to act quickly and decisively.
Reversal Zones:
The indicator plots reversal zones based on swing highs and lows in conjunction with RSI conditions. Green lines represent potential support levels (zone bottoms), while red lines represent potential resistance levels (zone tops). These zones provide traders with clear areas where price reversals are likely to occur.
Automated Alerts:
Custom alerts can be set for both buy and sell signals, providing real-time notifications when potential trading opportunities arise. This feature ensures that traders do not miss critical market moves.
How It Works
RSI Calculation:
The Relative Strength Index (RSI) is calculated to determine overbought and oversold conditions. When RSI exceeds the overbought threshold, it indicates that the market may be overbought, and when it falls below the oversold threshold, it indicates that the market may be oversold. This helps in identifying potential reversal points.
Swing High/Low Detection:
Swing highs and lows are detected using a specified lookback period. These points represent significant price levels where reversals are likely to occur. Swing highs are detected using the ta.pivothigh function, and swing lows are detected using the ta.pivotlow function.
Reversal Zones:
Reversal zones are defined by plotting lines at swing high and low levels when RSI conditions are met. These zones serve as visual cues for potential support and resistance areas, providing a structured framework for identifying reversal points.
Buy and Sell Signals:
Buy signals are generated when the price crosses above a defined reversal zone bottom, indicating a potential upward reversal. Sell signals are generated when the price crosses below a defined reversal zone top, indicating a potential downward reversal. These signals are further confirmed by the presence of bullish or bearish engulfing patterns.
Plotting and Alerts:
The indicator plots buy and sell signals directly on the chart with corresponding labels. Additionally, alerts can be set up to notify the user when a signal is generated, ensuring timely action.
Originality and Usefulness
Innovative Integration of Technical Tools:
The "Reversal Zones with Signals" indicator uniquely combines multiple technical analysis tools into a single, cohesive indicator. This integration provides a comprehensive view of market conditions, enhancing the accuracy of the signals and offering a robust tool for traders.
Enhanced Trading Decisions:
By providing clear and actionable signals, the indicator helps traders make better-informed decisions. The visualization of reversal zones and the integration of RSI and moving averages ensure that traders have a solid framework for identifying potential reversals.
Flexibility and Customization:
The customizable parameters allow traders to adapt the indicator to different trading styles and market conditions. This flexibility ensures that the indicator can be used effectively by a wide range of traders, from beginners to advanced professionals.
Clear and User-Friendly Interface:
The indicator's design prioritizes ease of use, with clear visual signals and intuitive settings. This user-friendly approach makes it accessible to traders of all experience levels.
Real-Time Alerts:
The ability to set up custom alerts ensures that traders are notified of potential trading opportunities as they arise, helping them to act quickly and efficiently.
Versatility Across Markets:
The indicator is suitable for use in various financial markets, including stocks, forex, and cryptocurrencies. Its adaptability across different asset classes makes it a valuable addition to any trader's toolkit.
How to Use
Adding the Indicator:
Add the "Reversal Zones with Signals" indicator to your chart.
Adjust the parameters (Sensitivity, RSI OverBought Value, RSI OverSold Value, Zone Length) to match your trading strategy and market conditions.
Interpreting Signals:
Buy Signal: A green "BUY" label appears below a bar, indicating a potential buying opportunity based on the detected reversal zone and price action.
Sell Signal: A red "SELL" label appears above a bar, indicating a potential selling opportunity based on the detected reversal zone and price action.
Setting Alerts:
Set alerts for buy and sell signals to receive notifications when potential trading opportunities arise. This ensures timely action and helps traders stay informed about critical market moves.

VIX and SKEW RSI Moving AveragesSKEW and VIX are both indicators of market volatility and risk, but they represent different aspects.
VIX (CBOE Volatility Index) :.
The VIX is a well-known indicator for predicting future market volatility. It is calculated primarily based on S&P 500 options premiums and indicates the degree of market instability and risk.
Typically, when the VIX is high, market participants view the future as highly uncertain and expect sharp volatility in stock prices. It is generally considered an indicator of market fear.
SKEW Index :.
The SKEW is a measure of how much market participants estimate the risk of future declines in stock prices, calculated by the CBOE (Chicago Board Options Exchange) and derived from the premium on S&P 500 options.
If the SKEW is high, market participants consider the risk of future declines in stock prices to be high. This generally indicates a "fat tail at the base" of the market and suggests that the market perceives it as very risky.
These indicators are used by market participants to indicate their concerns and expectations about future stock price volatility. In general, when the VIX is high and the SKEW is high, the market is considered volatile and risky. Conversely, when the VIX is low and the SKEW is low, the market is considered relatively stable and low risk.
Inverse Relationship between SKEW and VIX
It is often observed that there is an inverse correlation between SKEW and VIX. In general, the relationship is as follows
High VIX and low SKEW: When the VIX is high and the SKEW is low, the market is considered volatile while the risk of future stock price declines is low. This indicates that the market is exposed to sharp volatility, but market participants do not expect a major decline.
Low VIX and High SKEW: A low VIX and high SKEW indicates that the market is relatively stable, while the risk of future declines in stock prices is considered high. This indicates that the market is calm, but market participants are wary of a sharp future decline.
This inverse correlation is believed to be the result of market participants' psychology and expectations affecting the movements of the VIX and SKEW. For example, when the VIX is high, it is evident that the market is volatile, and under such circumstances, people tend to view the risk of a sharp decline in stock prices as low. Conversely, when the VIX is low, the market is considered relatively stable and the risk of future declines is likely to be higher.
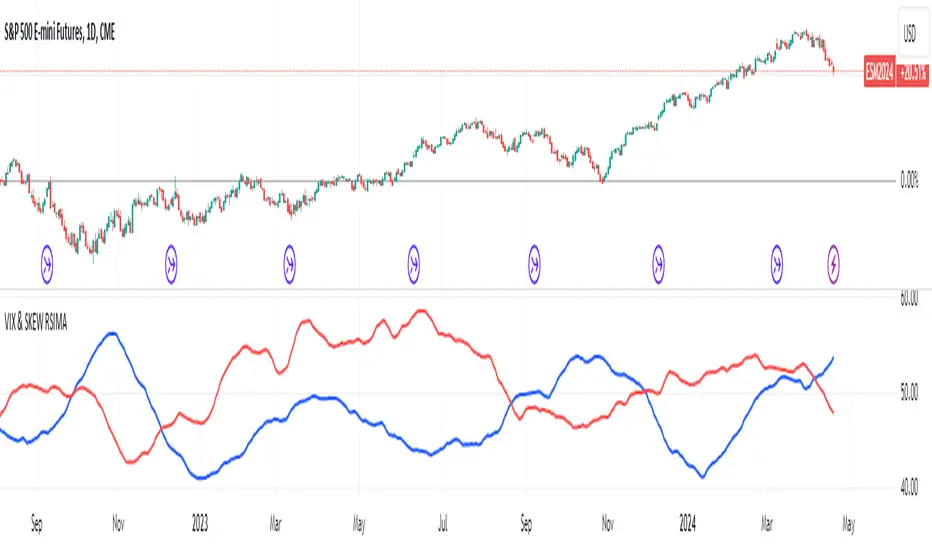
SKEWVIX RSIMACROSS
In order to compare the trends of the SKEW and VIX, the 50-period moving average of the Relative Strength Index (RSI) was used for verification. the RSI is an indicator of market overheating or overcooling, and the 50-period moving average can be used to determine the medium- to long-term trend. This analysis reveals how the inverse correlation between the SKEW and the VIX relates to the long-term moving average of the RSI.
how to use
Moving Average Direction
Rising blue for VIXRSI indicates increased uncertainty in the market
Rising red for SKEWRSI indicates optimism and beyond
RSI moving average crossing
When the SKEW is dominant, market participants are considered less concerned about a black swan event (significant unexpected price volatility). This suggests that the market is stable and willing to take risks. On the other hand, when the VIX is dominant, it indicates increased market volatility. Investors are more concerned about market uncertainty and tend to take more conservative positions to avoid risk. The direction of the moving averages and the crossing of the moving averages of the two indicators can give an indication of the state of the market.
SKEW>VIX Optimistic/Goldilocks
VIX>SKEW Uncertainty/turbulence
The market can be judged as follows.
BestRegards
RSI AcceleratorThe Relative Strength Index (RSI) is like a fitness tracker for the underlying time series. It measures how overbought or oversold an asset is, which is kinda like saying how tired or energized it is.
When the RSI goes too high, it suggests the asset might be tired and due for a rest, so it could be a sign it's gonna drop. On the flip side, when the RSI goes too low, it's like the asset is pumped up and ready to go, so it might be a sign it's gonna bounce back up. Basically, it helps traders figure out if a stock is worn out or revved up, which can be handy for making decisions about buying or selling.
The RSI Accelerator takes the difference between a short-term RSI(5) and a longer-term RSI(14) to detect short-term movements. When the short-term RSI rises more than the long-term RSI, it typically refers to a short-term upside acceleration.
The conditions of the signals through the RSI Accelerator are as follows:
* A bullish signal is generated whenever the Accelerator surpasses -20 after having been below it.
* A bearish signal is generated whenever the Accelerator breaks 20 after having been above it.

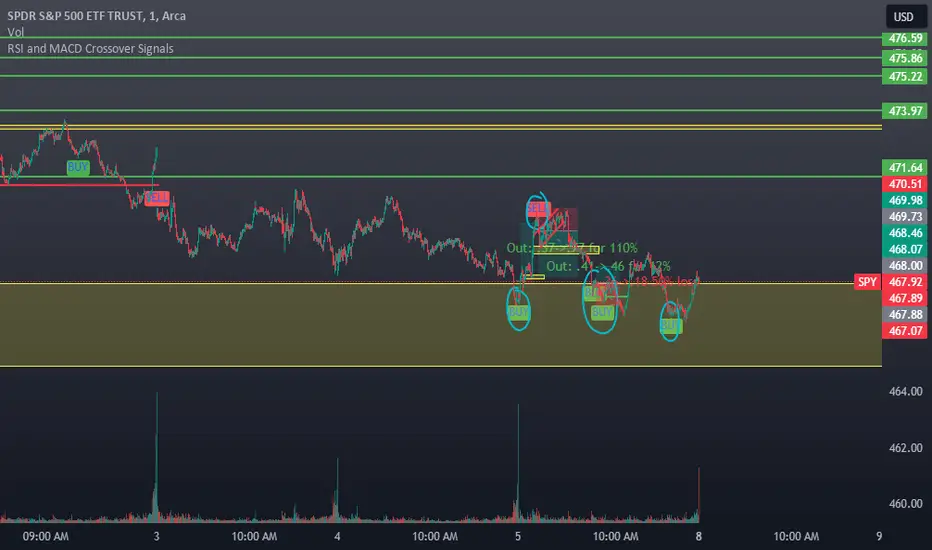
RSI and MACD Crossover SignalsBest for Short-Term/Intraday Trading on SPY, TSLA, NVDA
Strategy Concept:
This strategy is designed for short-term trading across various assets and timeframes (Recommend: 1min, 5min, 15min, 1hr, 4hr, 1day). It leverages the Relative Strength Index (RSI) and Moving Average Convergence Divergence (MACD) to identify potential buy and sell signals. The strategy aims to capture moments where the asset's price is likely to experience a reversal or a significant momentum shift.
By combining the RSI and MACD indicators, the strategy seeks to increase the accuracy of identifying potential trend reversals or continuations, taking into account both the momentum and the trend direction of the asset.
RSI (Relative Strength Index) Parameters:
The RSI period is set to 14
Overbought and oversold levels are set at 70 and 30, respectively
The RSI is used to identify potential reversal points when the asset is overbought or oversold
MACD (Moving Average Convergence Divergence) Parameters:
The MACD settings are configured with a fast length of 8, a slow length of 34, and a signal smoothing of 8
The MACD line crossing over or under the signal line is used to confirm the potential buy or sell signals indicated by the RSI
Signal Generation Logic:
Buy Signal:
Triggered when the RSI crosses above the oversold level (30).
Confirmed if the MACD line crosses above the signal line within a delay period of up to 4 candles after the RSI signal.
Sell Signal:
Triggered when the RSI crosses below the overbought level (70).
Confirmed if the MACD line crosses below the signal line within a delay period of up to 4 candles after the RSI signal.
Additional Features:
The script includes a notification system that alerts the trader when either a buy or sell signal is detected. The alert signal is combined with both the buy and sell signal in 1 so people without premium can be alerted when any signal appears.
Buy signals are visually represented on the chart below the price bars with a green "BUY" label.
Sell signals are indicated above the price bars with a red "SELL" label.
Usage and Application:
This strategy is versatile and recommended to be played with scalps and day trades. I prefer SPY 0DTE on the 1 and 5 minute timeframe and looking for bigger trend reversals on the 1hr, 4hr, and 1 day timeframe.
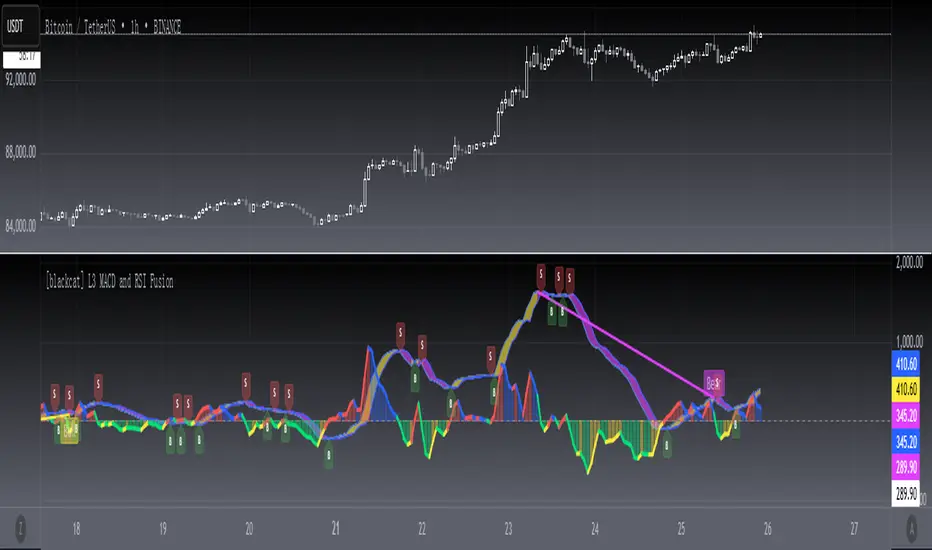
[blackcat] L3 MACD and RSI Fusion The MACD and RSI fusion is a popular technical analysis strategy used by traders to identify buy and sell signals in the market. The strategy makes use of two popular technical indicators, the Moving Average Convergence Divergence (MACD) and the Relative Strength Index (RSI), and combines them to create a powerful trading signal.
The MACD and RSI fusion was originally developed for the Chinese stock market and is commonly used by traders all over the world. The strategy is based on the idea that the MACD and RSI indicators can be used together to provide a more accurate and reliable signal.
To use the MACD and RSI fusion , traders need to follow a few simple steps. The following code is the TradingView Pine script v4 indicator equivalent of the original MACD and RSI fusion code:
```
//@version=4
study(" MACD and RSI fusion ", overlay=false)
// Define the simple fusion indicator
simple_fusion = (ema(close, 12) - ema(close, 26)) * 1.2 + rsi(close, 14) / 50
// Define the simple fusion lag indicator
simple_fusion_lag = nz(simple_fusion )
// Plot the simple fusion and simple fusion lag indicators
plot(simple_fusion, color=color.blue, title="simple fusion")
plot(simple_fusion_lag, color=color.red, title="simple fusion Lag")
```
This code defines the simple fusion and simple fusion Lag indicators and plots them on the chart. The simple fusion indicator is the sum of the 12- and 26-period exponential moving averages of the closing price, multiplied by 1.2, and added to the 14-period relative strength index of the closing price, divided by 50. The simple fusion Lag indicator is the value of the simple fusion indicator from the previous period.
Traders can use the simple fusion and simple fusion Lag indicators to identify buy and sell signals. When the simple fusion indicator crosses above the simple fusion Lag indicator, it is a buy signal, and when the simple fusion indicator crosses below the simple fusion Lag indicator, it is a sell signal.
In conclusion, the MACD and RSI fusion is a simple but powerful technical analysis strategy that combines two popular technical indicators to identify buy and sell signals in the market.
TIGER ALERT RSI DIVThats our first RSI DIV indicator for free use.
What is an RSI divergence?
What Is the Relative Strength Index (RSI)?
The relative strength index (RSI) is a momentum indicator used in technical analysis.
RSI measures the speed and magnitude of a security's recent price changes to evaluate overvalued or undervalued conditions in the price of that security.
The RSI can do more than point to overbought and oversold securities. It can also indicate securities that may be primed for a trend reversal or corrective pullback in price. It can signal when to buy and sell. T
raditionally, an RSI reading of 70 or above indicates an overbought situation. A reading of 30 or below indicates an oversold condition.

Aroon Oscillator of Adaptive RSI [Loxx]Aroon Oscillator of Adaptive RSI uses RSI to calculate AROON in attempt to capture more trend and momentum quicker than Aroon or RSI alone. Aroon Oscillator of Adaptive RSI has three different types of RSI calculations and the choice of either fixed, VHF Adaptive, or Band-pass Adaptive cycle measures to calculate RSI.
Arron Oscillator:
The Aroon Oscillator was developed by Tushar Chande in 1995 as part of the Aroon Indicator system. Chande’s intention for the system was to highlight short-term trend changes. The name Aroon is derived from the Sanskrit language and roughly translates to “dawn’s early light.”
The Aroon Oscillator is a trend-following indicator that uses aspects of the Aroon Indicator (Aroon Up and Aroon Down) to gauge the strength of a current trend and the likelihood that it will continue.
Aroon oscillator readings above zero indicate that an uptrend is present, while readings below zero indicate that a downtrend is present. Traders watch for zero line crossovers to signal potential trend changes. They also watch for big moves, above 50 or below -50 to signal strong price moves.
Wilders' RSI:
The Relative Strength Index (RSI) is a well versed momentum based oscillator which is used to measure the speed (velocity) as well as the change (magnitude) of directional price movements. Essentially RSI, when graphed, provides a visual mean to monitor both the current, as well as historical, strength and weakness of a particular market. The strength or weakness is based on closing prices over the duration of a specified trading period creating a reliable metric of price and momentum changes. Given the popularity of cash settled instruments (stock indexes) and leveraged financial products (the entire field of derivatives); RSI has proven to be a viable indicator of price movements.
RSX RSI:
RSI is a very popular technical indicator, because it takes into consideration market speed, direction and trend uniformity. However, the its widely criticized drawback is its noisy (jittery) appearance. The Jurk RSX retains all the useful features of RSI, but with one important exception: the noise is gone with no added lag.
Rapid RSI:
Rapid RSI Indicator, from Ian Copsey's article in the October 2006 issue of Stocks & Commodities magazine.
RapidRSI resembles Wilder's RSI, but uses a SMA instead of a WilderMA for internal smoothing of price change accumulators.
VHF Adaptive Cycle:
Vertical Horizontal Filter (VHF) was created by Adam White to identify trending and ranging markets. VHF measures the level of trend activity, similar to ADX DI. Vertical Horizontal Filter does not, itself, generate trading signals, but determines whether signals are taken from trend or momentum indicators. Using this trend information, one is then able to derive an average cycle length.
Band-pass Adaptive Cycle
Even the most casual chart reader will be able to spot times when the market is cycling and other times when longer-term trends are in play. Cycling markets are ideal for swing trading however attempting to “trade the swing” in a trending market can be a recipe for disaster. Similarly, applying trend trading techniques during a cycling market can equally wreak havoc in your account. Cycle or trend modes can readily be identified in hindsight. But it would be useful to have an objective scientific approach to guide you as to the current market mode.
There are a number of tools already available to differentiate between cycle and trend modes. For example, measuring the trend slope over the cycle period to the amplitude of the cyclic swing is one possibility.
We begin by thinking of cycle mode in terms of frequency or its inverse, periodicity. Since the markets are fractal ; daily, weekly, and intraday charts are pretty much indistinguishable when time scales are removed. Thus it is useful to think of the cycle period in terms of its bar count. For example, a 20 bar cycle using daily data corresponds to a cycle period of approximately one month.
When viewed as a waveform, slow-varying price trends constitute the waveform's low frequency components and day-to-day fluctuations (noise) constitute the high frequency components. The objective in cycle mode is to filter out the unwanted components--both low frequency trends and the high frequency noise--and retain only the range of frequencies over the desired swing period. A filter for doing this is called a bandpass filter and the range of frequencies passed is the filter's bandwidth.
Included:
-Toggle on/off bar coloring
-Customize RSI signal using fixed, VHF Adaptive, and Band-pass Adaptive calculations
-Choose from three different RSI types
Happy trading!
Multi-Timeframe RSI GridThe relative strength index (RSI) is a momentum indicator that measures the magnitude of recent price changes to evaluate overbought or oversold conditions. The RSI is normally displayed as an oscillator separately from price and can have a reading from 0 to 100. This indicator displays the current RSI levels at up to 6 timeframes (of your choosing) in a grid. If the RSI levels reach overbought (above 70) or oversold (below 30) conditions, it changes the color to help you see that RSI has reached extreme levels. Note that in TradingView, when the chart is on a higher timeframe, the lower timeframe RSI levels don't calculate properly. If those conditions are met, this indicator will hide those values in the grid. If none of your selected values are available, it hides the table completely. There are configuration options, like:
Position the grid in any corner of the screen
Style customization (color, size)
Customize RSI length

[ALERTS] ADX and DIThe average directional index (ADX) is a technical analysis metric. Analysts use it to determine the relative strength of a trend, with the direction of the trend either upwards or downwards.
The Average Directional Index (ADX) along with the Negative Directional Indicator (-DI) and the Positive Directional Indicator (+DI) are momentum strength indicators that evolved for use in stock trading. Commodities trader J. Welles Wilder pioneered their use. Technical traders who use charting techniques want to know when first spotting a shifting trend how strong that trend is and how likely it is to sustain itself over time. The ADX helps investors determine trend strength as they plan their investment strategies.
Confirmation on a chart and other momentum indicators help investors spot trend reversals. But some trends are more potent than others and investors want to better understand the strength of a trend. The ADX identifies a strong positive trend when the ADX is over 25 and a weak trend when the ADX is below 20. Investors can determine directional movement by analyzing the difference between two consecutive low prices and their correlated highs. The movement is +DM when the current high price, less the previous high price, is greater than the previous low price less the current low. The opposite applies in determining the negative or –DI.
When analyzing charts, stock price is the single most important variable to follow. ADX and other indicators are supplementary to price movements in providing additional directional information and support. For example, some of the best trends come about from price range consolidation. It is those tugs of war between buying and selling volumes that lead to breakouts and other trading opportunities.
The Inventor of the Average Directional Index
J. Welles Wilder, Jr. is a former American engineer and real estate developer who went on to revolutionize trading analysis by applying mathematical systems to the world of investing. In addition to developing the ADX, Wilder is also responsible for several other commonly used technical analysis tools including the Average True Range (ATR), the Relative Strength Index (RSI) and the Parabolic SAR.
www.investopedia.com
This script has alerts and includes the filter for markets with no trend defined.
Green Alert --> Long
Red Alert --> Short
Yellow Area --> Weak trend. ADX below threshold
Green candles --> Bullish Market
Red Candles --> Bearish Market
Orange candles --> No defined trend
Enjoy!

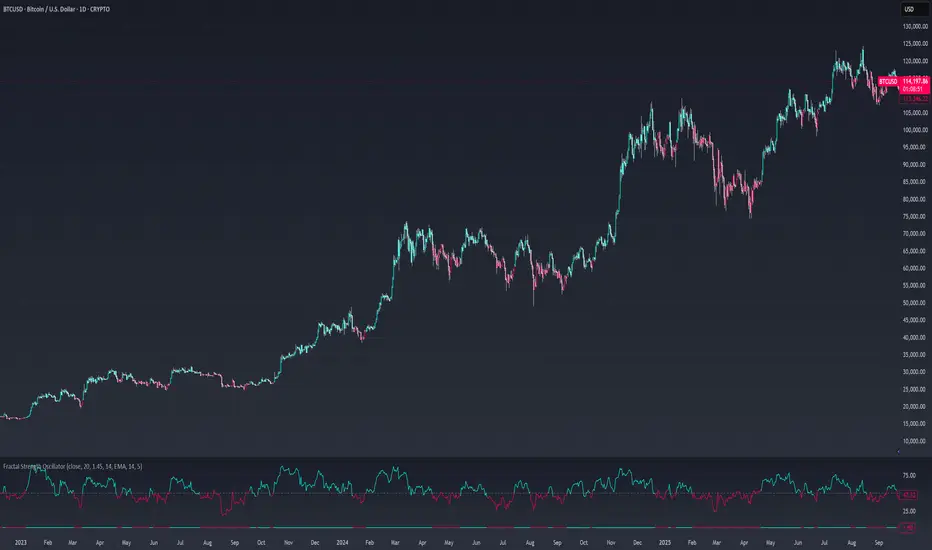
Fractal Strength OscillatorThe Fractal Strength Oscillator Indicator combines the Relative Strength Index (RSI) and Fractal Dimension Index (FDI) to identify market momentum and trend direction. By integrating RSI's momentum signals with FDI's fractal-based trend analysis, this indicator provides clear visual cues for bullish and bearish conditions through colored plots and price bars.
How It Works
RSI Calculation: Computes RSI based on a user-selected price source (default: Close) over a configurable period. Optional smoothing with various moving average types (e.g., SMA, EMA, ALMA) enhances signal clarity.
FDI Calculation: Measures market complexity using a fractal dimension over a user-defined period (default: 20). A threshold (default: 1.45) determines trend strength.
Trend Logic
Bullish Signal: RSI > 55 or FDI < threshold indicates upward momentum
Bearish Signal: RSI < 45 or FDI > threshold indicates downward momentum
Customization & Parameters
RSI Parameters: RSI length, smoothing option , MA type, MA length, ALMA sigma
FDI Parameters: FDI length, trend threshold.
Trading Applications
Momentum Trading: Use RSI and FDI signals for entry/exit points.
Trend Confirmation: Bar coloring aligns with trend signals.
Reversal Detection: Identify shifts when RSI or FDI crosses thresholds
Final Note
The Fractal Strength Oscillator Indicator is a straightforward tool for traders seeking momentum and trend insights. Its combination of RSI, FDI, and visual cues supports informed trading decisions. Backtest thoroughly and use within a broader strategy. This indicator is for educational purposes and not financial advice.
WRAMA Channel (Weighted RSI ATR MA)OVERVIEW
The WRAMA Channel (Weighted RSI ATR MA) is an advanced technical analysis tool designed to react more quickly to price movements compared to indicators using conventional moving averages. It combines the Relative Strength Index (RSI), Average True Range (ATR), and a weighted moving average, resulting in the WRAMA. This indicator forms a dynamic price channel based on a weighted average that incorporates both trend strength (via RSI) and market volatility (via ATR). It helps traders identify trends, potential reversals, and breakout signals, while offering broad customization options.
Key Features
WRAMA Price Channel:
Generates a dynamic channel around the weighted moving average (WRAMA), adapting to market volatility and momentum, similar to Bollinger Bands. Users are encouraged to adjust channel width and length according to their strategy.
The upper and lower channel bands are calculated based on a percentage deviation from the baseline line.
The channel fill color changes depending on the price's position relative to the baseline (green above, red below), with an optional gradient for better visualization.
Weighted Moving Average (WRAMA):
WRAMA is a custom weighted moving average (MA1), where closing prices are weighted based on RSI and ATR, allowing it to dynamically adapt to market conditions.
Baseline: The WRAMA line calculated over a user-defined period.
WRAMA Calculation:
RSI Weight: Based on RSI value. When RSI is in extreme zones (below the lower threshold or above the upper threshold), an extreme weight is applied. Otherwise, the weight is based on the squared RSI value divided by 100, raised to a power defined by the rsi_weight_factor.
ATR Weight: Based on the ATR-to-average-ATR ratio. If ATR exceeds a threshold (atr_threshold × avg_atr), an extreme weight is applied. Otherwise, the weight is based on the squared ratio of ATR to average ATR, raised to the power of the atr_weight_factor.
Combined Weight: RSI and ATR weights are combined using a rsi_atr_balance parameter. Final weight = RSI weight × balance + ATR weight × (1 - balance).
WRAMA Calculation: The closing price is multiplied by the combined weight. The result is averaged over the ma_length period and divided by the average of the weights, forming the WRAMA line. For current WRAMA (ma_length = 1), the calculation simplifies to a single weighted price.
Additional Moving Averages:
For additional confirmations, the indicator supports up to five moving averages (MA1–MA5) with various types (SMA, EMA, WMA, HMA, ALMA) and customizable periods.
All additional MAs are calculated based on WRAMA or its baseline, ensuring consistency and enabling deeper analysis within a unified methodology. MA trend directions can be tracked in a built-in signal table.
Trading Signals:
Breakout Signals: Breakouts above/below the channel are optionally marked with triangle shapes (green for bullish, red for bearish).
MA Signals: Price position relative to MAs or their slope generates bullish/bearish signals. These are optionally visualized with default triangles (green up, red down).
A signal table in the top-right corner summarizes the status of each moving average – bullish, bearish, or neutral.
Customization Options
Channel Settings:
MA Period: Length of the WRAMA baseline (default: 100).
Channel Deviation : Percentage offset from the baseline for upper/lower bands (default: 1.5%).
RSI Settings:
RSI Period: Length of the RSI calculation (default: 14).
RSI Upper/Lower Threshold: Overbought/oversold levels (default: 70/30).
RSI Weight Factor: Influence of RSI on weighting (default: 2.0).
ATR Settings:
ATR Period: ATR calculation length (default: 14).
ATR Threshold: Volatility threshold as a multiple of average ATR (default: 1.5).
ATR Weight Factor: Influence of ATR on weighting (default: 2.0).
RSI & ATR Combined:
Extreme Weight: Weight applied in extreme RSI/ATR conditions (default: 3.0).
RSI/ATR Balance: Balance between RSI and ATR influence (default: 0.5).
Signal Settings:
Show Breakout Signals: Enable/disable breakout triangles.
Show MA Signals: Enable/disable MA-based signals.
MA Signal Source: Choose between current WRAMA or baseline.
MA Signal Analysis: Based on price position or slope.
Neutral Threshold : Minimum distance from MA for signal neutrality (default: 0.5%).
Minimum MA Slope : Minimum slope for trend direction signals (default: 0.01%).
Moving Averages (MA1–MA5):
Options to enable/disable, select type (SMA, EMA, WMA, HMA, ALMA), set period length, and choose color.
Style Settings:
Gradient Fill: Enable/disable gradient coloring within the channel.
Show Baseline: Enable/disable WRAMA baseline visibility.
Colors: Customize line, fill, and signal colors.
Use Cases
Trend Identification: The WRAMA channel highlights trend direction and potential reversal zones when price contacts the channel edges.
Breakout Signals: Channel breakouts may indicate trend shifts or momentum surges.
MA Analysis: The signal table provides a clear summary of market direction (bullish, bearish, or neutral) based on selected moving averages.
Trading Strategies: Suitable for trend-following, mean-reversion, and scalping strategies, depending on user preferences and settings.
Notes
The indicator offers a high degree of flexibility, making it adaptable to various trading styles, instruments, and timeframes.
It is recommended to adjust channel length and width to fit your trading strategy.
Backtesting settings on historical data is advised to optimize parameters for a specific strategy and market.

All SMAs Bullish/Bearish Screener (Enhanced)All SMAs Bullish/Bearish Screener Enhanced: Uncover High-Conviction Trend Alignments with Confidence
Description:
Are you ready to elevate your trading from mere guesswork to precise, data-driven decisions? The "All SMAs Bullish/Bearish Screener Enhanced" is not just another indicator; it's a sophisticated, yet user-friendly, trend-following powerhouse designed to cut through market noise and pinpoint high-probability trading opportunities. Built on the foundational strength of comprehensive Moving Average confluence and fortified with critical confirmation signals from Momentum, Volume, and Relative Strength, this script empowers you to identify truly robust trends and manage your trades with unparalleled clarity.
The Power of Multi-Factor Confluence: Beyond Simple Averages
In the unpredictable world of financial markets, true strength or weakness is rarely an isolated event. It's the harmonious alignment of multiple technical factors that signals a high-conviction move. While our original "All SMAs Bullish/Bearish Screener" intelligently identified stocks where price was consistently above or below a full spectrum of Simple Moving Averages (5, 10, 20, 50, 100, 200), this Enhanced version takes it a crucial step further.
We've integrated a powerful three-pronged confirmation system to filter out weaker signals and highlight only the most compelling setups:
Momentum (Rate of Change - ROC): A strong trend isn't just about price direction; it's about the speed and intensity of that movement. Positive momentum confirms that buyers are still aggressively pushing price higher (for bullish signals), while negative momentum validates selling pressure (for bearish signals).
Volume: No trend is truly trustworthy without the backing of smart money. Above-average volume accompanying an "All SMAs" alignment signifies strong institutional participation and conviction behind the move. It separates genuine trend starts from speculative whims.
Relative Strength Index (RSI): This versatile oscillator ensures the trend isn't just "there," but that it's developing healthily. We use RSI to confirm a bullish bias (above 50) or a bearish bias (below 50), adding another layer of confidence to the direction.
When the price aligns above ALL six critical SMAs, and is simultaneously confirmed by robust positive momentum, healthy volume, and a bullish RSI bias, you have an exceptionally strong "STRONGLY BULLISH" signal. This confluence often precedes sustained upward moves, signaling prime accumulation phases. Conversely, a "STRONGLY BEARISH" signal, where price is below ALL SMAs with negative momentum, confirming volume, and a bearish RSI bias, indicates powerful distribution and potential for significant downside.
How to Use This Enhanced Screener:
Add to Chart: Go to TradingView's Pine Editor, paste the script, and click "Add to Chart."
Customize Parameters: Fine-tune the lengths of your SMAs, RSI, Momentum, and Volume averages via the indicator's settings. Experiment to find what best suits your trading style and the assets you trade.
Choose Your Timeframe Wisely:
Daily (1D) and 4-Hour (240 min) are highly recommended. These timeframes cut through intraday noise and provide more reliable, actionable signals for swing and position trading.
Shorter timeframes (e.g., 15min, 60min) can be used by advanced day traders for very short-term entries, but be aware of increased volatility and noise.
Visual Confirmation:
Green/Red Triangles: Appear on your chart, indicating confirmed bullish or bearish signals.
Background Color: The chart background will subtly turn lime green for "STRONGLY BULLISH" and red for "STRONGLY BEARISH" conditions.
On-Chart Status Table: A clear table displays the current signal status ("STRONGLY BULLISH/BEARISH," or "SMAs Mixed") for immediate feedback.
Set Up Alerts (Your Primary Screener Tool): This is the game-changer! Create custom alerts on TradingView based on the "Confirmed Bullish Trade" and "Confirmed Bearish Trade" conditions. Receive instant notifications (email, pop-up, mobile) for any stock in your watchlist that meets these stringent criteria. This allows you to scan the entire market effortlessly and act decisively.
Strategic Stop-Loss Placement: The Trader's Lifeline
Even the most robust signals can fail. Protecting your capital is paramount. For this trend-following strategy, your stop-loss should be placed where the underlying trend structure is broken.
For a "STRONGLY BULLISH" Trade: Place your stop-loss just below the most recent significant swing low (higher low). This is the last point where buyers stepped in to support the price. If price breaks below this, your bullish thesis is invalidated.
For a "STRONGLY BEARISH" Trade: Place your stop-loss just above the most recent significant swing high (lower high). If price breaks above this, your bearish thesis is invalidated.
Alternatively, consider placing your stop-loss just below the 20-period SMA (for bullish trades) or above the 20-period SMA (for bearish trades). A significant close beyond this intermediate-term average often indicates a critical shift in momentum. Always ensure your chosen stop-loss adheres to your pre-defined risk per trade (e.g., 1-2% of capital).
Disciplined Profit Booking: Maximizing Gains
Just as important as knowing when you're wrong is knowing when to take profits.
Trailing Stop-Loss: As your trade moves into profit, trail your stop-loss upwards (for longs) or downwards (for shorts). You can trail it using:
Previous Swing Lows/Highs: Move your stop to just below each new higher low (for longs) or just above each new lower high (for shorts).
A Moving Average (e.g., 10-period or 20-period SMA): If price closes below your chosen trailing SMA, exit. This allows you to ride the trend while protecting accumulated profits.
Target Levels: Identify potential resistance levels (for longs) or support levels (for shorts) using pivot points, previous highs/lows, or Fibonacci extensions. Consider taking partial profits at these levels and letting the rest run with a trailing stop.
Loss of Confluence: If the "STRONGLY BULLISH/BEARISH" condition ceases to be met (e.g., RSI crosses below 50, or volume drops significantly), this can be a signal to reduce or exit your position, even if your stop-loss hasn't been hit.
The "All SMAs Bullish/Bearish Screener Enhanced" is your comprehensive partner in navigating the markets. By combining robust trend identification with critical confirmation signals and disciplined risk management, you're equipped to make smarter, more confident trading decisions. Add it to your favorites and unlock a new level of precision in your trading journey!
#PineScript #TradingView #SMA #MovingAverage #TrendFollowing #StockScreener #TechnicalAnalysis #Bullish #Bearish #QQQ #Momentum #Volume #RSI #SPY #TradingStrategy #Enhanced #Signals #Analysis #DayTrading #SwingTrading

Bear Market Probability Model# Bear Market Probability Model: A Multi-Factor Risk Assessment Framework
The Bear Market Probability Model represents a comprehensive quantitative framework for assessing systemic market risk through the integration of 13 distinct risk factors across four analytical categories: macroeconomic indicators, technical analysis factors, market sentiment measures, and market breadth metrics. This indicator synthesizes established financial research methodologies to provide real-time probabilistic assessments of impending bear market conditions, offering institutional-grade risk management capabilities to retail and professional traders alike.
## Theoretical Foundation
### Historical Context of Bear Market Prediction
Bear market prediction has been a central focus of financial research since the seminal work of Dow (1901) and the subsequent development of technical analysis theory. The challenge of predicting market downturns gained renewed academic attention following the market crashes of 1929, 1987, 2000, and 2008, leading to the development of sophisticated multi-factor models.
Fama and French (1989) demonstrated that certain financial variables possess predictive power for stock returns, particularly during market stress periods. Their three-factor model laid the groundwork for multi-dimensional risk assessment, which this indicator extends through the incorporation of real-time market microstructure data.
### Methodological Framework
The model employs a weighted composite scoring methodology based on the theoretical framework established by Campbell and Shiller (1998) for market valuation assessment, extended through the incorporation of high-frequency sentiment and technical indicators as proposed by Baker and Wurgler (2006) in their seminal work on investor sentiment.
The mathematical foundation follows the general form:
Bear Market Probability = Σ(Wi × Ci) / ΣWi × 100
Where:
- Wi = Category weight (i = 1,2,3,4)
- Ci = Normalized category score
- Categories: Macroeconomic, Technical, Sentiment, Breadth
## Component Analysis
### 1. Macroeconomic Risk Factors
#### Yield Curve Analysis
The inclusion of yield curve inversion as a primary predictor follows extensive research by Estrella and Mishkin (1998), who demonstrated that the term spread between 3-month and 10-year Treasury securities has historically preceded all major recessions since 1969. The model incorporates both the 2Y-10Y and 3M-10Y spreads to capture different aspects of monetary policy expectations.
Implementation:
- 2Y-10Y Spread: Captures market expectations of monetary policy trajectory
- 3M-10Y Spread: Traditional recession predictor with 12-18 month lead time
Scientific Basis: Harvey (1988) and subsequent research by Ang, Piazzesi, and Wei (2006) established the theoretical foundation linking yield curve inversions to economic contractions through the expectations hypothesis of the term structure.
#### Credit Risk Premium Assessment
High-yield credit spreads serve as a real-time gauge of systemic risk, following the methodology established by Gilchrist and Zakrajšek (2012) in their excess bond premium research. The model incorporates the ICE BofA High Yield Master II Option-Adjusted Spread as a proxy for credit market stress.
Threshold Calibration:
- Normal conditions: < 350 basis points
- Elevated risk: 350-500 basis points
- Severe stress: > 500 basis points
#### Currency and Commodity Stress Indicators
The US Dollar Index (DXY) momentum serves as a risk-off indicator, while the Gold-to-Oil ratio captures commodity market stress dynamics. This approach follows the methodology of Akram (2009) and Beckmann, Berger, and Czudaj (2015) in analyzing commodity-currency relationships during market stress.
### 2. Technical Analysis Factors
#### Multi-Timeframe Moving Average Analysis
The technical component incorporates the well-established moving average convergence methodology, drawing from the work of Brock, Lakonishok, and LeBaron (1992), who provided empirical evidence for the profitability of technical trading rules.
Implementation:
- Price relative to 50-day and 200-day simple moving averages
- Moving average convergence/divergence analysis
- Multi-timeframe MACD assessment (daily and weekly)
#### Momentum and Volatility Analysis
The model integrates Relative Strength Index (RSI) analysis following Wilder's (1978) original methodology, combined with maximum drawdown analysis based on the work of Magdon-Ismail and Atiya (2004) on optimal drawdown measurement.
### 3. Market Sentiment Factors
#### Volatility Index Analysis
The VIX component follows the established research of Whaley (2009) and subsequent work by Bekaert and Hoerova (2014) on VIX as a predictor of market stress. The model incorporates both absolute VIX levels and relative VIX spikes compared to the 20-day moving average.
Calibration:
- Low volatility: VIX < 20
- Elevated concern: VIX 20-25
- High fear: VIX > 25
- Panic conditions: VIX > 30
#### Put-Call Ratio Analysis
Options flow analysis through put-call ratios provides insight into sophisticated investor positioning, following the methodology established by Pan and Poteshman (2006) in their analysis of informed trading in options markets.
### 4. Market Breadth Factors
#### Advance-Decline Analysis
Market breadth assessment follows the classic work of Fosback (1976) and subsequent research by Brown and Cliff (2004) on market breadth as a predictor of future returns.
Components:
- Daily advance-decline ratio
- Advance-decline line momentum
- McClellan Oscillator (Ema19 - Ema39 of A-D difference)
#### New Highs-New Lows Analysis
The new highs-new lows ratio serves as a market leadership indicator, based on the research of Zweig (1986) and validated in academic literature by Zarowin (1990).
## Dynamic Threshold Methodology
The model incorporates adaptive thresholds based on rolling volatility and trend analysis, following the methodology established by Pagan and Sossounov (2003) for business cycle dating. This approach allows the model to adjust sensitivity based on prevailing market conditions.
Dynamic Threshold Calculation:
- Warning Level: Base threshold ± (Volatility × 1.0)
- Danger Level: Base threshold ± (Volatility × 1.5)
- Bounds: ±10-20 points from base threshold
## Professional Implementation
### Institutional Usage Patterns
Professional risk managers typically employ multi-factor bear market models in several contexts:
#### 1. Portfolio Risk Management
- Tactical Asset Allocation: Reducing equity exposure when probability exceeds 60-70%
- Hedging Strategies: Implementing protective puts or VIX calls when warning thresholds are breached
- Sector Rotation: Shifting from growth to defensive sectors during elevated risk periods
#### 2. Risk Budgeting
- Value-at-Risk Adjustment: Incorporating bear market probability into VaR calculations
- Stress Testing: Using probability levels to calibrate stress test scenarios
- Capital Requirements: Adjusting regulatory capital based on systemic risk assessment
#### 3. Client Communication
- Risk Reporting: Quantifying market risk for client presentations
- Investment Committee Decisions: Providing objective risk metrics for strategic decisions
- Performance Attribution: Explaining defensive positioning during market stress
### Implementation Framework
Professional traders typically implement such models through:
#### Signal Hierarchy:
1. Probability < 30%: Normal risk positioning
2. Probability 30-50%: Increased hedging, reduced leverage
3. Probability 50-70%: Defensive positioning, cash building
4. Probability > 70%: Maximum defensive posture, short exposure consideration
#### Risk Management Integration:
- Position Sizing: Inverse relationship between probability and position size
- Stop-Loss Adjustment: Tighter stops during elevated risk periods
- Correlation Monitoring: Increased attention to cross-asset correlations
## Strengths and Advantages
### 1. Comprehensive Coverage
The model's primary strength lies in its multi-dimensional approach, avoiding the single-factor bias that has historically plagued market timing models. By incorporating macroeconomic, technical, sentiment, and breadth factors, the model provides robust risk assessment across different market regimes.
### 2. Dynamic Adaptability
The adaptive threshold mechanism allows the model to adjust sensitivity based on prevailing volatility conditions, reducing false signals during low-volatility periods and maintaining sensitivity during high-volatility regimes.
### 3. Real-Time Processing
Unlike traditional academic models that rely on monthly or quarterly data, this indicator processes daily market data, providing timely risk assessment for active portfolio management.
### 4. Transparency and Interpretability
The component-based structure allows users to understand which factors are driving risk assessment, enabling informed decision-making about model signals.
### 5. Historical Validation
Each component has been validated in academic literature, providing theoretical foundation for the model's predictive power.
## Limitations and Weaknesses
### 1. Data Dependencies
The model's effectiveness depends heavily on the availability and quality of real-time economic data. Federal Reserve Economic Data (FRED) updates may have lags that could impact model responsiveness during rapidly evolving market conditions.
### 2. Regime Change Sensitivity
Like most quantitative models, the indicator may struggle during unprecedented market conditions or structural regime changes where historical relationships break down (Taleb, 2007).
### 3. False Signal Risk
Multi-factor models inherently face the challenge of balancing sensitivity with specificity. The model may generate false positive signals during normal market volatility periods.
### 4. Currency and Geographic Bias
The model focuses primarily on US market indicators, potentially limiting its effectiveness for global portfolio management or non-USD denominated assets.
### 5. Correlation Breakdown
During extreme market stress, correlations between risk factors may increase dramatically, reducing the model's diversification benefits (Forbes and Rigobon, 2002).
## References
Akram, Q. F. (2009). Commodity prices, interest rates and the dollar. Energy Economics, 31(6), 838-851.
Ang, A., Piazzesi, M., & Wei, M. (2006). What does the yield curve tell us about GDP growth? Journal of Econometrics, 131(1-2), 359-403.
Baker, M., & Wurgler, J. (2006). Investor sentiment and the cross‐section of stock returns. The Journal of Finance, 61(4), 1645-1680.
Baker, S. R., Bloom, N., & Davis, S. J. (2016). Measuring economic policy uncertainty. The Quarterly Journal of Economics, 131(4), 1593-1636.
Barber, B. M., & Odean, T. (2001). Boys will be boys: Gender, overconfidence, and common stock investment. The Quarterly Journal of Economics, 116(1), 261-292.
Beckmann, J., Berger, T., & Czudaj, R. (2015). Does gold act as a hedge or a safe haven for stocks? A smooth transition approach. Economic Modelling, 48, 16-24.
Bekaert, G., & Hoerova, M. (2014). The VIX, the variance premium and stock market volatility. Journal of Econometrics, 183(2), 181-192.
Brock, W., Lakonishok, J., & LeBaron, B. (1992). Simple technical trading rules and the stochastic properties of stock returns. The Journal of Finance, 47(5), 1731-1764.
Brown, G. W., & Cliff, M. T. (2004). Investor sentiment and the near-term stock market. Journal of Empirical Finance, 11(1), 1-27.
Campbell, J. Y., & Shiller, R. J. (1998). Valuation ratios and the long-run stock market outlook. The Journal of Portfolio Management, 24(2), 11-26.
Dow, C. H. (1901). Scientific stock speculation. The Magazine of Wall Street.
Estrella, A., & Mishkin, F. S. (1998). Predicting US recessions: Financial variables as leading indicators. Review of Economics and Statistics, 80(1), 45-61.
Fama, E. F., & French, K. R. (1989). Business conditions and expected returns on stocks and bonds. Journal of Financial Economics, 25(1), 23-49.
Forbes, K. J., & Rigobon, R. (2002). No contagion, only interdependence: measuring stock market comovements. The Journal of Finance, 57(5), 2223-2261.
Fosback, N. G. (1976). Stock market logic: A sophisticated approach to profits on Wall Street. The Institute for Econometric Research.
Gilchrist, S., & Zakrajšek, E. (2012). Credit spreads and business cycle fluctuations. American Economic Review, 102(4), 1692-1720.
Harvey, C. R. (1988). The real term structure and consumption growth. Journal of Financial Economics, 22(2), 305-333.
Kahneman, D., & Tversky, A. (1979). Prospect theory: An analysis of decision under risk. Econometrica, 47(2), 263-291.
Magdon-Ismail, M., & Atiya, A. F. (2004). Maximum drawdown. Risk, 17(10), 99-102.
Nickerson, R. S. (1998). Confirmation bias: A ubiquitous phenomenon in many guises. Review of General Psychology, 2(2), 175-220.
Pagan, A. R., & Sossounov, K. A. (2003). A simple framework for analysing bull and bear markets. Journal of Applied Econometrics, 18(1), 23-46.
Pan, J., & Poteshman, A. M. (2006). The information in option volume for future stock prices. The Review of Financial Studies, 19(3), 871-908.
Taleb, N. N. (2007). The black swan: The impact of the highly improbable. Random House.
Whaley, R. E. (2009). Understanding the VIX. The Journal of Portfolio Management, 35(3), 98-105.
Wilder, J. W. (1978). New concepts in technical trading systems. Trend Research.
Zarowin, P. (1990). Size, seasonality, and stock market overreaction. Journal of Financial and Quantitative Analysis, 25(1), 113-125.
Zweig, M. E. (1986). Winning on Wall Street. Warner Books.

RSI Candlestick Oscillator [LuxAlgo]The RSI Candlestick Oscillator displays a traditional Relative Strength Index (RSI) as candlesticks. This indicator references OHLC data to locate each candlestick point relative to the current RSI Value, leading to a more accurate representation of the Open, High, Low, and Close price of each candlestick in the context of RSI.
In addition to the candlestick display, Divergences are detected from the RSI candlestick highs and lows and can be displayed over price on the chart.
🔶 USAGE
Translating candlesticks into the RSI oscillator is not a new concept and has been attempted many times before. This indicator stands out because of the specific method used to determine the candlestick OHLC values. When compared to other RSI Candlestick indicators, you will find that this indicator clearly and definitively correlates better to the on-chart price action.
Traditionally, the RSI indicator is simply one running value based on (typically) the close price of the chart. By introducing high, low, and open values into the oscillator, we can better gauge the specific price action throughout the intrabar movements.
Interactions with the RSI levels can now take multiple forms, whether it be a full-bodied breakthrough or simply a wick test. Both can provide a new analysis of price action alongside RSI.
An example of wick interactions and full-bodied interactions can be seen below.
As a result of the candlestick display, divergences become simpler to spot. Since the candlesticks on the RSI closely resemble the candlesticks on the chart, when looking for divergence between the chart and RSI, it is more obvious when the RSI and price are diverging.
The divergences in this indicator not only show on the RSI oscillator, but also overlay on the price chart for clearer understanding.
🔹 Filtering Divergence
With the candlesticks generating high and low RSI values, we can better sense divergences from price, since these points are generally going to be more dramatic than the (close) RSI value.
This indicator displays each type of divergence:
Bullish Divergence
Bearish Divergence
Hidden Bullish Divergence
Hidden Bearish Divergence
From these, we get many less-than-useful indications, since every single divergence from price is not necessarily of great importance.
The Divergence Filter disregards any divergence detected that does not extend outside the RSI upper or lower values.
This does not replace good judgment, but this filter can be helpful in focusing attention towards the extremes of RSI for potential reversal spotting from divergence.
🔶 DETAILS
In order to get the desired results for a display that resembles price action while following RSI, we must scale. The scaling is the most important part of this indicator.
To summarize the process:
Identify a range on Price and RSI
Consider them as equal to create a scaling factor
Use the scaling factor to locate RSI's "Price equivalent" Upper, Lower, & Mid on the Chart
Use those prices (specifically the RSI Mid) to check how far each OHLC value lies from it
Use those differences to translate the price back to the RSI Oscillator, pinning the OHLC values at their relative location to our anchor (RSI Mid)
🔹 RSI Channel
To better understand, and for your convenience, the indicator includes the option to display the RSI Channel on the chart. This channel helps to visualize where the scaled RSI values are relative to price.
If you analyze the RSI channel, you are likely to notice that the price movement throughout the channel matches the same movement witnessed in the RSI Oscillator below. This makes sense since they are the exact same thing displayed on different scales.
🔹 Scaling the Open
While the scaling method used is important, and provides a very close view of the real price bar's relative locations on the RSI oscillator… It is designed for a single purpose.
The scaling does NOT make the price candles display perfectly on the RSI oscillator.
The largest place where this is noticeable is with the opening of each candle.
For this reason, we have included a setting that modifies the opening of each RSI candle to be more accurate to the chart's price candles.
This setting positions the current bar's opening RSI candlestick value accurately relative to the price's open location to the previous closing price. As seen below.
🔶 SETTINGS
🔹 RSI Candles
RSI Length: Sets the Length for the RSI Oscillator.
Overbought/Oversold Levels: Sets the Overbought and Oversold levels for the RSI Oscillator.
Scale Open for Chart Accuracy: As described above, scales the open of each candlestick bar to more accurately portray the chart candlesticks.
🔹 Divergence
Show on Chart: Choose to display divergence line on the chart as well as on the Oscillator.
Divergence Length: Sets the pivot width for divergence detection. Normal Fractal Pivot Detection is used.
Divergence Style: Change color and line style for Regular and Hidden divergences, as well as toggle their display.
Divergence Filter: As described above, toggle on or off divergence filtering.
🔹 RSI Channel
Toggle: Display RSI Channel on Chart.
Color: Change RSI Channel Color

RSI-Volume Momentum Signal ScoreRSI-Volume Momentum Signal Score
Description
The RSI-Volume Momentum Signal Score is a predictive technical indicator designed to identify bullish and bearish momentum shifts by combining volume-based momentum with the Relative Strength Index (RSI). It generates a Signal Score derived from:
• The divergence between short-term and long-term volume (Volume Oscillator), and
• RSI positioning relative to a user-defined threshold.
This hybrid approach helps traders detect early signs of price movement based on volume surges and overbought/oversold conditions.
The Signal Score is computed as follows:
Signal Score = Volume Momentum x RSI Divergence Factor
Volume Momentum = tanh ((Volume Oscillator value (vo) – Volume Threshold)/Scaling Factor)
RSI Divergence Factor = ((RSI Threshold – RSI Period)/Scaling Factor)
Or,
Signal Score = tanh((vo - voThreshold) / scalingFactor) * ((rsiThreshold - rsi) / scalingFactor)
The logic of this formula are as follows:
• If Volume Oscillator >= Volume Threshold and RSI <= RSI Threshold: Bullish Signal (+1 x Scaling Factor)
• If Volume Oscillator >= Volume Threshold and RSI >= (100 – RSI Threshold): Bearish Signal (-1 x Scaling Factor)
• Otherwise: Neutral (0)
The tanh function provides the normalization process. It ensures that the final signal score is bounded between -1 and 1, increases sensitivity to early changes in volume patterns based on RSI conditions, and prevent sudden jumps in signals ensuring smooth and continuous signal line.
Input Fields
The input fields allow users to customize the behavior of the indicator based on their trading strategy:
Short-Term Volume MA
- Default: `2`
- Description: The period for the short-term moving average of volume.
- Purpose: Captures short-term volume trends.
Long-Term Volume MA)
- Default: `10`
- Description: The period for the long-term moving average of volume.
- Purpose: Captures long-term volume trends for comparison with the short-term trend.
RSI Period)
- Default: `3`
- Description: The period for calculating the RSI.
- Purpose: Measures the relative strength of price movements over the specified period.
Volume Oscillator Threshold
- Default: `70`
- Description: The threshold for the Volume Oscillator to determine significant volume momentum.
- Purpose: Filters out weak volume signals.
RSI Threshold
- Default: `25`
- Description: The RSI level used to identify overbought or oversold conditions.
- Purpose: Helps detect potential reversals in price momentum.
Signal Scaling Factor
- Default: `10`
- Description: A multiplier for the signal score.
- Purpose: Adjusts the magnitude of the signal score for better visualization.
How To Use It for Trading:
Upcoming Bullish Signal: Signal line turns from Gray to Green or from Green to Gray
Upcoming Bearish Signal: Signal line turns from Gray to Red or from Red to Gray
Note: The price that corresponds to the transition of Signal line from Gray to Green or Red and vise versa is the signal price for upcoming bullish or bearish signal.
The signal score dynamically adjusts based on volume and RSI thresholds, making it adaptable to various market conditions, and this is what makes the indicator unique from other traditional indicators.
Unique Features
Unlike traditional indicators, this indicator combines two different dimensions—volume trends and RSI divergence—for more comprehensive signal generation. The use of tanh() to scale and smooth the signal is a mathematically elegant way to manage signal noise and highlight genuine trends. Traders can tune the scaling factor and thresholds to adapt the indicator for scalping, swing trading, or longer-term investing.

Multi-Fibonacci Trend Average[FibonacciFlux]Multi-Fibonacci Trend Average (MFTA): An Institutional-Grade Trend Confluence Indicator for Discerning Market Participants
My original indicator/Strategy:
Engineered for the sophisticated demands of institutional and advanced traders, the Multi-Fibonacci Trend Average (MFTA) indicator represents a paradigm shift in technical analysis. This meticulously crafted tool is designed to furnish high-definition trend signals within the complexities of modern financial markets. Anchored in the rigorous principles of Fibonacci ratios and augmented by advanced averaging methodologies, MFTA delivers a granular perspective on trend dynamics. Its integration of Multi-Timeframe (MTF) filters provides unparalleled signal robustness, empowering strategic decision-making with a heightened degree of confidence.
MFTA indicator on BTCUSDT 15min chart with 1min RSI and MACD filters enabled. Note the refined signal generation with reduced noise.
MFTA indicator on BTCUSDT 15min chart without MTF filters. While capturing more potential trading opportunities, it also generates a higher frequency of signals, including potential false positives.
Core Innovation: Proprietary Fibonacci-Enhanced Supertrend Averaging Engine
The MFTA indicator’s core innovation lies in its proprietary implementation of Supertrend analysis, strategically fortified by Fibonacci ratios to construct a truly dynamic volatility envelope. Departing from conventional Supertrend methodologies, MFTA autonomously computes not one, but three distinct Supertrend lines. Each of these lines is uniquely parameterized by a specific Fibonacci factor: 0.618 (Weak), 1.618 (Medium/Golden Ratio), and 2.618 (Strong/Extended Fibonacci).
// Fibonacci-based factors for multiple Supertrend calculations
factor1 = input.float(0.618, 'Factor 1 (Weak/Fibonacci)', minval=0.01, step=0.01, tooltip='Factor 1 (Weak/Fibonacci)', group="Fibonacci Supertrend")
factor2 = input.float(1.618, 'Factor 2 (Medium/Golden Ratio)', minval=0.01, step=0.01, tooltip='Factor 2 (Medium/Golden Ratio)', group="Fibonacci Supertrend")
factor3 = input.float(2.618, 'Factor 3 (Strong/Extended Fib)', minval=0.01, step=0.01, tooltip='Factor 3 (Strong/Extended Fib)', group="Fibonacci Supertrend")
This multi-faceted architecture adeptly captures a spectrum of market volatility sensitivities, ensuring a comprehensive assessment of prevailing conditions. Subsequently, the indicator algorithmically synthesizes these disparate Supertrend lines through arithmetic averaging. To achieve optimal signal fidelity and mitigate inherent market noise, this composite average is further refined utilizing an Exponential Moving Average (EMA).
// Calculate average of the three supertends and a smoothed version
superlength = input.int(21, 'Smoothing Length', tooltip='Smoothing Length for Average Supertrend', group="Fibonacci Supertrend")
average_trend = (supertrend1 + supertrend2 + supertrend3) / 3
smoothed_trend = ta.ema(average_trend, superlength)
The resultant ‘Smoothed Trend’ line emerges as a remarkably responsive yet stable trend demarcation, offering demonstrably superior clarity and precision compared to singular Supertrend implementations, particularly within the turbulent dynamics of high-volatility markets.
Elevated Signal Confluence: Integrated Multi-Timeframe (MTF) Validation Suite
MFTA transcends the limitations of conventional trend indicators by incorporating an advanced suite of three independent MTF filters: RSI, MACD, and Volume. These filters function as sophisticated validation protocols, rigorously ensuring that only signals exhibiting a confluence of high-probability factors are brought to the forefront.
1. Granular Lower Timeframe RSI Momentum Filter
The Relative Strength Index (RSI) filter, computed from a user-defined lower timeframe, furnishes critical momentum-based signal validation. By meticulously monitoring RSI dynamics on an accelerated timeframe, traders gain the capacity to evaluate underlying momentum strength with precision, prior to committing to signal execution on the primary chart timeframe.
// --- Lower Timeframe RSI Filter ---
ltf_rsi_filter_enable = input.bool(false, title="Enable RSI Filter", group="MTF Filters", tooltip="Use RSI from lower timeframe as a filter")
ltf_rsi_timeframe = input.timeframe("1", title="RSI Timeframe", group="MTF Filters", tooltip="Timeframe for RSI calculation")
ltf_rsi_length = input.int(14, title="RSI Length", minval=1, group="MTF Filters", tooltip="Length for RSI calculation")
ltf_rsi_threshold = input.int(30, title="RSI Threshold", minval=0, maxval=100, group="MTF Filters", tooltip="RSI value threshold for filtering signals")
2. Convergent Lower Timeframe MACD Trend-Momentum Filter
The Moving Average Convergence Divergence (MACD) filter, also calculated on a lower timeframe basis, introduces a critical layer of trend-momentum convergence confirmation. The bullish signal configuration rigorously mandates that the MACD line be definitively positioned above the Signal line on the designated lower timeframe. This stringent condition ensures a robust indication of converging momentum that aligns synergistically with the prevailing trend identified on the primary timeframe.
// --- Lower Timeframe MACD Filter ---
ltf_macd_filter_enable = input.bool(false, title="Enable MACD Filter", group="MTF Filters", tooltip="Use MACD from lower timeframe as a filter")
ltf_macd_timeframe = input.timeframe("1", title="MACD Timeframe", group="MTF Filters", tooltip="Timeframe for MACD calculation")
ltf_macd_fast_length = input.int(12, title="MACD Fast Length", minval=1, group="MTF Filters", tooltip="Fast EMA length for MACD")
ltf_macd_slow_length = input.int(26, title="MACD Slow Length", minval=1, group="MTF Filters", tooltip="Slow EMA length for MACD")
ltf_macd_signal_length = input.int(9, title="MACD Signal Length", minval=1, group="MTF Filters", tooltip="Signal SMA length for MACD")
3. Definitive Volume Confirmation Filter
The Volume Filter functions as an indispensable arbiter of trade conviction. By establishing a dynamic volume threshold, defined as a percentage relative to the average volume over a user-specified lookback period, traders can effectively ensure that all generated signals are rigorously validated by demonstrably increased trading activity. This pivotal validation step signifies robust market participation, substantially diminishing the potential for spurious or false breakout signals.
// --- Volume Filter ---
volume_filter_enable = input.bool(false, title="Enable Volume Filter", group="MTF Filters", tooltip="Use volume level as a filter")
volume_threshold_percent = input.int(title="Volume Threshold (%)", defval=150, minval=100, group="MTF Filters", tooltip="Minimum volume percentage compared to average volume to allow signal (100% = average)")
These meticulously engineered filters operate in synergistic confluence, requiring all enabled filters to definitively satisfy their pre-defined conditions before a Buy or Sell signal is generated. This stringent multi-layered validation process drastically minimizes the incidence of false positive signals, thereby significantly enhancing entry precision and overall signal reliability.
Intuitive Visual Architecture & Actionable Intelligence
MFTA provides a demonstrably intuitive and visually rich charting environment, meticulously delineating trend direction and momentum through precisely color-coded plots:
Average Supertrend: Thin line, green/red for uptrend/downtrend, immediate directional bias.
Smoothed Supertrend: Bold line, teal/purple for uptrend/downtrend, cleaner, institutionally robust trend.
Dynamic Trend Fill: Green/red fill between Supertrends quantifies trend strength and momentum.
Adaptive Background Coloring: Light green/red background mirrors Smoothed Supertrend direction, holistic trend perspective.
Precision Buy/Sell Signals: ‘BUY’/‘SELL’ labels appear on chart when trend touch and MTF filter confluence are satisfied, facilitating high-conviction trade action.
MFTA indicator applied to BTCUSDT 4-hour chart, showcasing its effectiveness on higher timeframes. The Smoothed Length parameter is increased to 200 for enhanced smoothness on this timeframe, coupled with 1min RSI and Volume filters for signal refinement. This illustrates the indicator's adaptability across different timeframes and market conditions.
Strategic Applications for Institutional Mandates
MFTA’s sophisticated design provides distinct advantages for advanced trading operations and institutional investment mandates. Key strategic applications include:
High-Probability Trend Identification: Fibonacci-averaged Supertrend with MTF filters robustly identifies high-probability trend continuations and reversals, enhancing alpha generation.
Precision Entry/Exit Signals: Volume and momentum-filtered signals enable institutional-grade precision for optimized risk-adjusted returns.
Algorithmic Trading Integration: Clear signal logic facilitates seamless integration into automated trading systems for scalable strategy deployment.
Multi-Asset/Timeframe Versatility: Adaptable parameters ensure applicability across diverse asset classes and timeframes, catering to varied trading mandates.
Enhanced Risk Management: Superior signal fidelity from MTF filters inherently reduces false signals, supporting robust risk management protocols.
Granular Customization and Parameterized Control
MFTA offers unparalleled customization, empowering users to fine-tune parameters for precise alignment with specific trading styles and market conditions. Key adjustable parameters include:
Fibonacci Factors: Adjust Supertrend sensitivity to volatility regimes.
ATR Length: Control volatility responsiveness in Supertrend calculations.
Smoothing Length: Refine Smoothed Trend line responsiveness and noise reduction.
MTF Filter Parameters: Independently configure timeframes, lookback periods, and thresholds for RSI, MACD, and Volume filters for optimal signal filtering.
Disclaimer
MFTA is meticulously engineered for high-quality trend signals; however, no indicator guarantees profit. Market conditions are unpredictable, and trading involves substantial risk. Rigorous backtesting and forward testing across diverse datasets, alongside a comprehensive understanding of the indicator's logic, are essential before live deployment. Past performance is not indicative of future results. MFTA is for informational and analytical purposes only and is not financial or investment advice.
